The top section of the Cloud DNS Reporting tab will show package utilization information. It compares what you have used to what is included in your subscription. It is possible that the “included” column does not display the information correctly, like you see in the screenshot below. If this is the case, please feel free to create a support case to have this corrected.
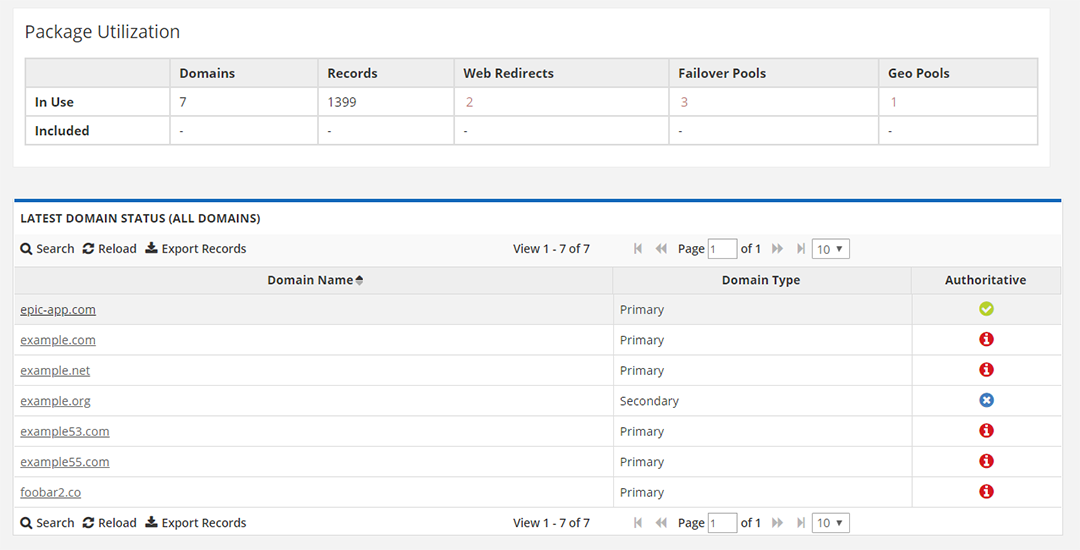
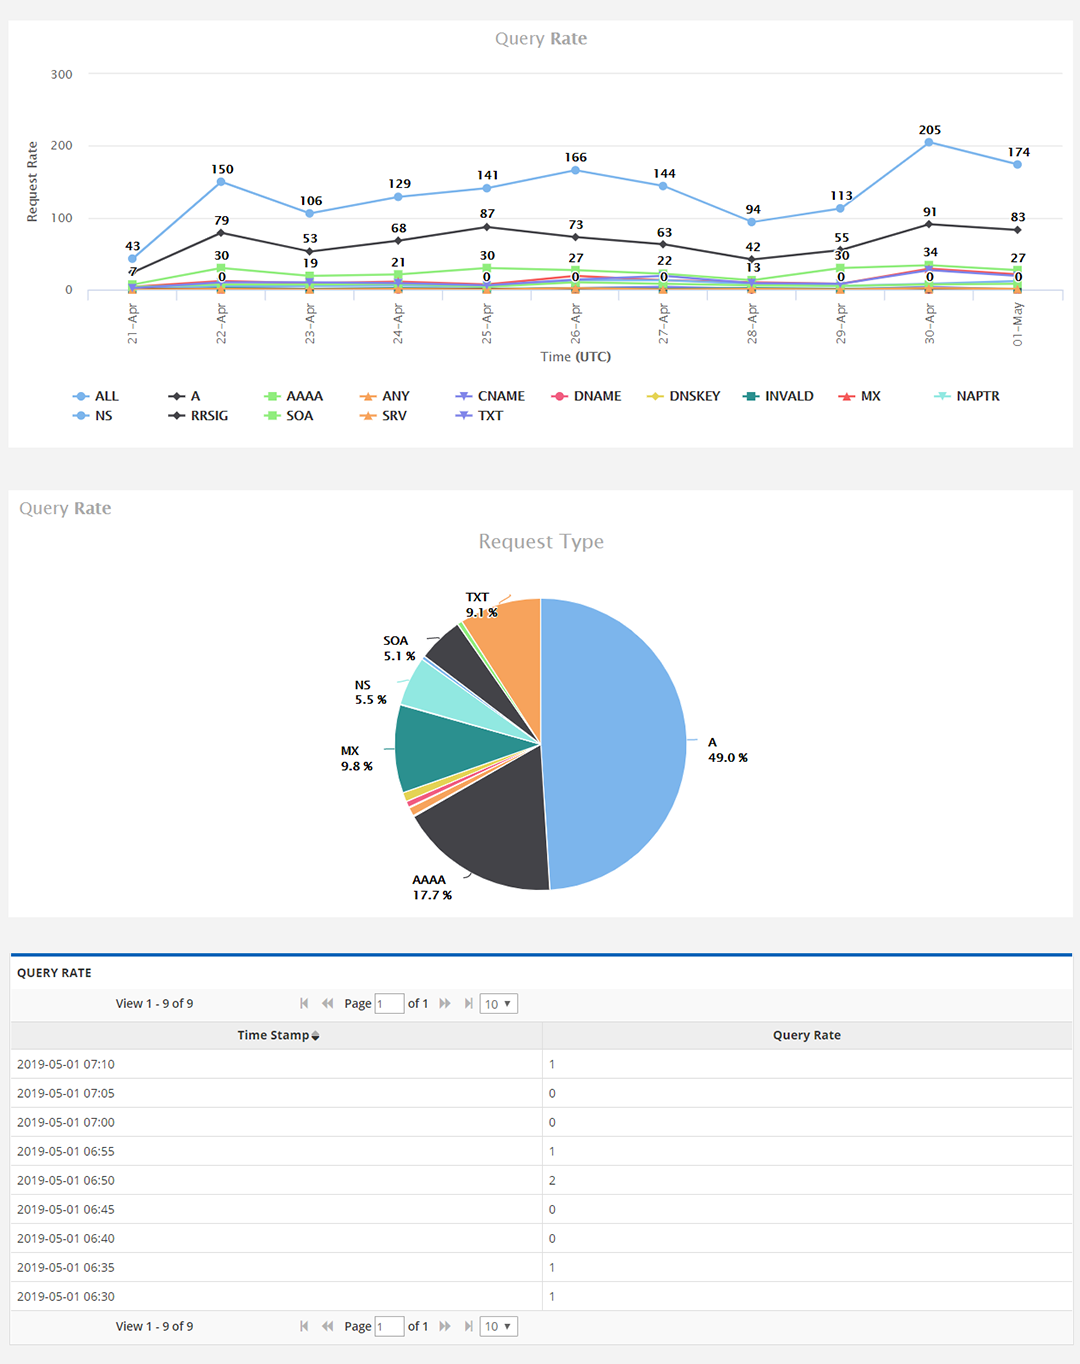
The table above shows the domains that are configured within our platform. If a domain is “Authoritative”, meaning it is pointing to Total Uptime DNS servers, you can click on it in the left-most column to bring up various stats as shown below.
These stats will show query rate count over time, the query rate broken down by record type, and a raw query rate table. If you adjust the drop-down menu for the time-period, these charts will also update.
We do NOT have a breakdown of specific query types, e.g. all hits specifically for ftp.example.com or similar. We’re often asked if this is possible in order to find out if a record type is used. Generally we’ve found that every record type has queries, even if they are not used. Scanners and bad actors like to scan DNS zones to see if they exist, and this behavior would show traffic to records even if they are not really utilized. If it is critical that you see more granular hit data for specific records, please create a support case. We do retain some of this information for no more than the most recent 24 hours for DDoS analysis and mitigation purposes, so we may be able to provide a little bit of detail.