
The Server Status tab displays a history of UP and DOWN status events for devices that are part of DNS Failover Pool and/or are used in Networking (e.g. Cloud Load Balancing, Firewall, etc.) Every time a device comes UP or goes DOWN it will be logged in this table. For DNS Failover, this means that the number of datacenters specified in the “Failover After” drop-down menu have all agreed that the device status has changed. For Networking, UP and DOWN status is listed here individually for each region since each Cloud Node makes routing decisions independently. If you have created an alert list and assigned it to a device, you may also receive an email notification. The log will display the Device Name, the Type (“Failover” for a device part of a DNS Failover pool, or “Server” for a device used networking), the Region that detected the status change (applicable to Networking servers only), the Status (UP or DOWN) and the details of the event such as the IP address, port etc. The Date & Time displayed is Eastern United States time (UTC/GMT-5 by default, UTC/GMT-4 during daylight savings months). Once a device status entry is made into the table by our system, it cannot be deleted. Information may be purged after 90 days.
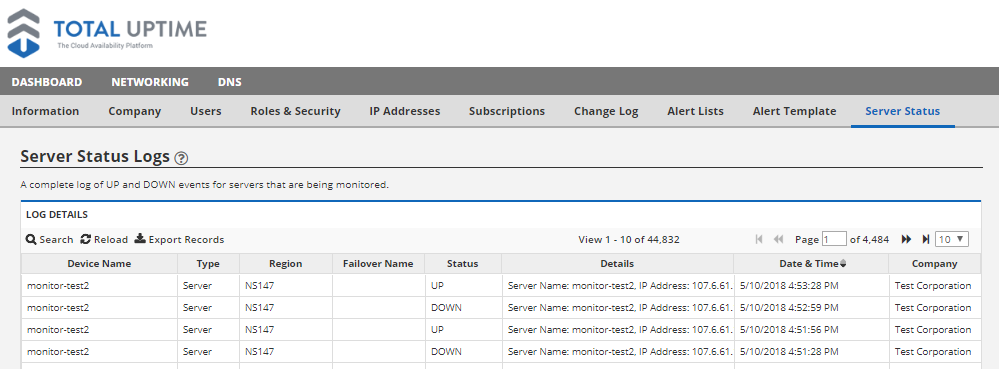
Server Status Headings:
By default, the Server Status is sorted by Date & Time, but you can sort according to any category by clicking on the desired category header. Click again to switch from sorting ascending to descending.
- Device Name: The name of the device that the alert was given for. This is the name you gave the server when you set it up on our system.
- Type: This column will show either “Failover” or “Server”, depending on if the alert is referring to a CloudDNS Failover pool or a server within our Load Balancing system.
- Region: For “Failover” alerts, this field will be blank. For “Server” alerts this will show the region that your server was unavailable from. Load Balanced servers are monitored from seven different regions:
- APAC – Asia-Pacific
- EU-N – Europe North
- EU-W – Europe West
- US-C – US Central
- US-E – US East
- US-NW – US North-West
- US-W – US West
- Failover Name: For “Server” alerts, this field will be blank. For “Failover” alerts, this will show the name of the failover pool the server belongs to.
- Status: This field will show either DOWN or UP, depending on whether the alert is to notify you of a server going down or coming up.
- Details: This will show specific details about the alert such as:
- Server Name/Failover Entry Name
- IP Address
- Status
- Reason
- Time
- Date & Time: This shows the date and time the alert was sent. The Date & Time displayed is Eastern United States time (UTC/GMT-5 by default, UTC/GMT-4 during daylight savings months).
- Company Name: If you’ve got multiple sub-companies, this will show which company the alert was made for.
Search: Use this field to search for alerts.
Clear Filter: You can press the Clear Filter button at any time to clear your search filter and display all alerts.
![]()
Reload: Refreshes the current screen.
Export Records: Allows you to Export the entire alert log record into a spreadsheet with a “.csv” extension for later reference. The spreadsheet downloads automatically to your browser’s default save folder with the file name “ServerStatus_ XXXXXXXXXXXX.csv” where the X’s are a unique identifier. At this time, it is not possible to save a portion of the Server Status alerts (such as the results from your search query) only the entire Server Status alert list is available to be saved.