
Customers who subscribe to Cloud DNS Failover (included in the Professional, Premium & Enterprise packages) will have access to the MONITORS tab, as shown in the image below. Monitors do not work on their own, but are attached to devices within a DNS Failover pool and are used to detect the status or availability of that device for automating DNS changes. (It is important to note that the same monitors are used in our networking solutions and that they are interchangeable, so in many ways (but not all) this documentation applies to both.)
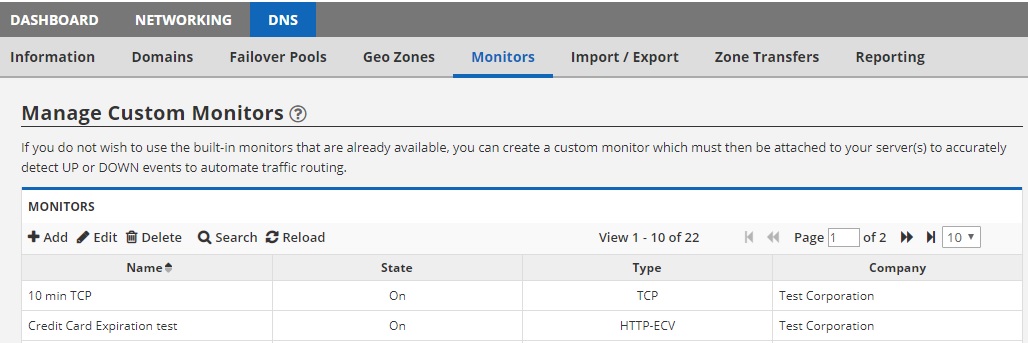
The monitors tab is used to create your own custom monitors. There are a number of built-in monitors that we’ve created for you to get started right away. But should you require something other than this, you must create a custom monitor here.
Creating your first monitor
When you first land on this monitors tab, you will see that no monitors exist. To create your first monitor, click the ADD button on the toolbar. This will open up a dialog box like the one shown below:
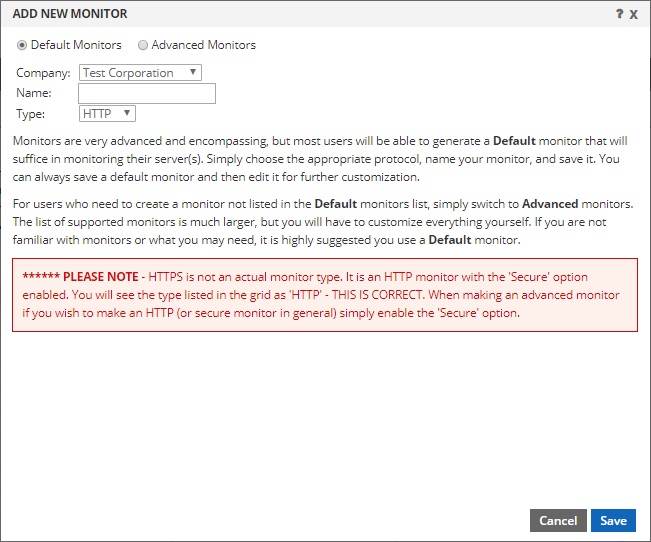
There are two modes for configuring monitors. As seen above, there are Default Monitors and Advanced Monitors. Default monitors are simply monitors that have a default configuration. There are 4 pre-configured options for you. HTTP, HTTPS, PING, TCP. Simply choose the type, provide the name and click the ADD button. These default monitors are the easiest to configure and put into service right away. And because they have all the same settings as an advanced monitor (they are just pre-configured for you) they are otherwise identical to advanced monitors and are very easy to edit after saving to adjust to suit your needs.
If you prefer to configure all of the parameters from the start, you can change the radio button to Advanced Monitors. When you change the radio button, you will see the window change to something like this:
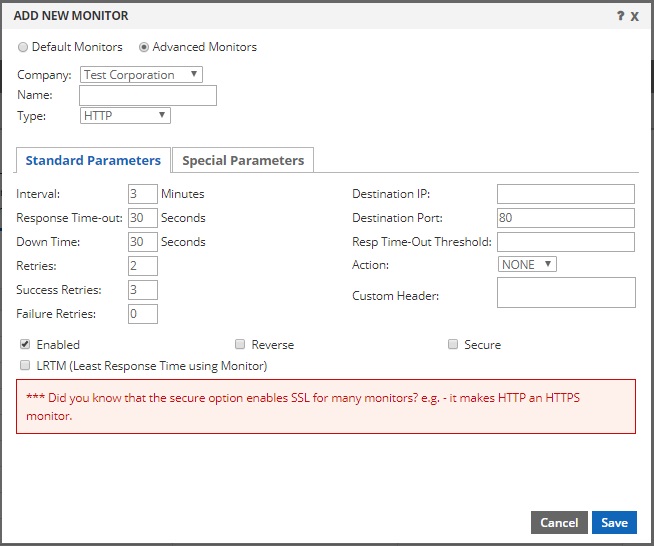
You will also see this screen after you’ve created a default monitor, but have chosen to edit it after the initial save.
Monitor Settings (edit a default, or a new advanced)
There are many different monitor types, which we will cover below. But many of the settings you see in the image above are standard for most monitors. Below are the definitions for each of the properties you see above:
- Name: This can be anything you want. It is simply used for your easy reference and will appear in the select menu of a DNS Failover pool.
- Type: This is the monitor type, for example PING, HTTP etc. (we explain each option in detail below)
- Interval: This is a number that specifies how frequently (in minutes) the monitor will check the device(s) that it is attached to. The lowest interval currently supported is 1 minute and the maximum is 349 minutes. [Enterprise Customers can get monitors that check as frequently as every 10 seconds.]
- Response Time-out: This is how long the monitor should wait for a response from the device in seconds. For example, if this is an HTTP monitor and the web page takes longer than this number of seconds to load, the test would be considered ‘failed’. Make sure this number is not too low. Acceptable values are from 1 to 20939 seconds.
- Down Time: Think of this as a monitoring break or a resting period. After a device is determined ‘down’ due to regular checks at the specified interval, this is how long monitoring will pause before resuming checks again (to see if it is back up). Acceptable values are from 1 to 20939 seconds. This allows you to keep a device down for an extended period of time by taking a break from monitoring.
- Retries: This is the number of consecutive checks that will determine when a device should be considered DOWN. For example, if you check a device with an interval of 1 (minute) and retries is 3, the device will be considered DOWN after 3 consecutive checks (3 minutes). This can be overridden by Failure Retries below. Valid entries are from 1 to 127.
- Success Retries: This is the number of consecutive checks that are required to bring the device back UP again. For example, if you check a device every 1 minute and this is set to 5, it would take 5 consecutive successful retries (5 minutes) to bring the device UP. If you want the device to come back UP and be put into service sooner, keep this number low. Keep in mind that a higher number does ensure that the device is truly back up and stable. Valid entries are from 1 to 32.
- Failure Retries: This setting has a default value of 0 (zero). Zero means “disabled” and allows the Retries value above to dictate when a device should be taken down. Otherwise, this is the number of failed probes within the Retries specified above that is required to bring the device DOWN. For example, if Retries is set to 8, you might configure Failure Retries to 4. This would bring the device DOWN after 4 failed checks out of the most recent 8 performed. Failure Retries must be 1 digit lower than the Retries field or no greater than 32, whichever is lower.
- Destination IP: This field accepts an IPv4 address and is optional. If you do NOT specify an IP, it will inherit the IP of the device you attach it to, which is highly recommended. The only use case we have thought of for specifying an IP here is if you want to take a device down based on the response from another device. For example, you could set this IP to be that of your firewall, but then attach the monitor to all your devices. When the firewall stops responding, all devices that use this monitor would be taken down, even if they were still reachable.
- Destination Port: This is the port number that the check should be sent to. It is not applicable for all monitor types, like PING, for example. For HTTP it could be 80, for HTTPS it could be 443. Standard port numbers are not required. It should be configured to the actual port your device is responding on.
- Resp Time-Out Threshold: This setting is not currently used and can be left blank.
- Action: This setting is not currently used and can be left blank.
- Custom Header: This could also be called a host header. For example, if your website will not load by placing the IP in the browser, it may need the hostname to load it. In such a scenario, enter it here. For example “www.example.com”. This does not force the monitor to use DNS to resolve your site, it simply couples the host header in the request using the IP of the device it is attached to (or the destination IP, if specified).
- Enabled: This checkbox is enabled by default. It determines if the monitor is active or not. If disabled, any device(s) that the monitor is attached to would not be monitored.
- Reverse: This check box makes the monitor work in reverse. For example, if you configure an HTTP monitor to look for a 200 response code and it receives it, under normal circumstances it would make the device it is attached to go UP. But when reverse is checked, it would make the device go DOWN.
- Secure: This check box will enable TLS (SSL) between the monitoring node and the device(s) being monitored. For example, to check an HTTPS site (vs. just HTTP) you would need to check this box and most likely also set the port to 443 (or whichever port your HTTPS site is configured to respond on).
- LRTM: This is for the Least Response Time Monitoring. It enables calculation of response time and is only applicable to load balancing applications. It will not impact a monitor used for DNS Failover.
Monitor Types Defined
Total Uptime supports 20 different monitor types for determining the availability of the device(s) they are attached to. DNS Failover currently allows you to attach a single monitor to a device (in load balancing, you can attach multiple monitors to a device). Below is further detail on each of the monitor types:
- HTTP: This monitor is designed to make a HEAD or GET request to a page via any port you specify (usually 80) to obtain the response status code. This includes codes from IETF internet standards. By going to the special parameters tab you can edit more advanced settings such as the acceptable response status codes as well as the URL. The HTTP Request on the special parameters tab is set for “HEAD /” by default. This means it is requesting the root of your site. If you want it to request a specific page, you could alter the HTTP Request to something like this: “HEAD /directory/page.php” as an example. Note the importance of keeping a space between HEAD and the /. While HEAD simply loads the header of the page, you can change it to GET as well to load the entire page.
- HTTPS: The HTTPS monitor is actually an HTTP monitor, identical to that outlined above, except with the secure checkbox selected as well as the port appropriately changed (to 443, as an example). All of the other parameters remain the same.
- PING: This monitor type sends a standard ICMP (Internet Control Message Protocol) echo request to the destination and waits for the ICMP echo reply. How long you are willing to wait for the response is determined by the Response Time Out value. For example, if you want to detect high latency, keep the response time out value low, at no more than 2 seconds, preferably 1 second (1000 ms).
- TCP: This monitor type attempts to establish a typical 3-way handshake (SYN, SYN-ACK, ACK) with the destination. If successful, it closes the connection. Other than PING, it is one of the simplest and most reliable monitors, but it is simply used to see if a device is responding on a particular port. For example, just because a web server responds successfully via TCP on port 80, it doesn’t necessarily mean it is serving up web pages.
- HTTP-CONTENT: This monitor type is a little different than the standard HTTP monitor. It establishes a connection with the device using a typical TCP 3-way handshake. When the connection is established, it uses the send string (on the special parameters tab) to load the first 24K bytes of the page that is specified. (By default the send string is simply “GET /” which would load your home page — and like the HTTP monitor, this can be adjusted accordingly). It then expects to find the result of the Receive String (also specified on the special parameters tab) within that content. If that string is found, the monitor will report UP. If it is not found, it will report DOWN (unless the reverse checkbox is checked, of course). If the receive string box is empty, then any content will be found acceptable and will be reported as UP. This type of monitor is handy if you want to scrape the page for content, e.g. look for your company name in the title tag or something similar, to better assert that the page has displayed the right content.
- HTTP-RESPONSE: This monitor type is similar to the standard HTTP monitor defined above whereby it can be configured with an HTTP Request to load a specific page, and it looks for an HTTP request response code as specified (200 by default). This monitor, however, has the added benefit of analyzing the responses received from client requests to determine if the device is sending valid content back (e.g. a 200 response code as well). This is an ideal monitor-type to configure the reverse checkbox on. In such a scenario, you could also configure it to look for a 501 response code and when it starts seeing 501 response codes being sent to clients, it would take the service down. When there is no client traffic, it probes based on the interval and HTTP Request path specified. When there is client traffic, it analyzes the results.
- DNS: This monitor type sends the DNS query specified on the special parameters tab to the device. The most common DNS port is 53, however any port is supported. The protocol the monitor will use is strictly UDP. You specify the query to be made (e.g. www.example.com), the query type (e.g. Address (A) or AAAA) and then add IP addresses (either IPv4 for A or IPv6 for AAAA) that are acceptable in the response. A maximum of 5 IP addresses can be configured for analysis. If the response matches, the device would be considered UP. If the response does not match or times out, the device would be considered DOWN.
- DNS-TCP: This monitor type is identical to the DNS monitor, except that it uses a TCP port that you specify, typically 53.
- FTP: This monitor type attempts to log into an FTP server over the TCP port that is specified (typically 21). It requires that you specify a username and password on the special parameters tab so it can log into the device. Once logged in, the monitor looks for a typical 200 response code so it knows that it has successfully logged in. It will then issue a ‘quit’ and terminate.
- LDAP: This monitor type checks an LDAP (Lightweight Directory Access Protocol) service by authenticating and sending a search query to it. It requires that you specify the Base DN and Bind DN (directory name) on the special parameters tab. The monitor also supports configuration of a Filter, Attribute and Password parameters.
- MYSQL: This monitor type checks a MySQL service by sending a custom search query to it. If the search query returns results, the device would be marked UP. If it does not return results or if it times out, it would be marked DOWN. On the special parameters tab you must specify the Database, Query, User Name and Password.
- NNTP: This monitor type checks an NNTP (Network News Transfer Protocol) server by connecting and looking for the newsgroup you specify. If the group exists, the search is successful and the device would be marked UP. If it does not match or times out, the device would be marked down. It requires that you configure the Group Name on the special parameters tab.
- POP3: This monitor type checks a POP3 (Post Office Protocol 3) server by opening a connection (typically on port 110) and looking for the correct response codes. It requires that you specify a User Name and Password on the special parameters tab.
- RADIUS: This monitor type checks the state of a RADIUS server by sending an authentication request. It requires that you configure a User Name, Password and Radius Key (also known as the shared secret) on the special parameters tab. In most instances you would configure the monitor to look for a response code of “2”, the default Access-Accept response.
- RTSP: This monitor checks the state of an RTSP (Real Time Streaming Protocol) server by opening a connection. The connection that it opens and the response that it expects differs based on the network configuration. It requires that you specify the RTSP Request and acceptable response codes on the special parameters tab. For example, your RTSP Request string may be “OPTIONS *” (without the quotation marks). This request string must not exceed 163 characters.
- SIP-UDP: This monitor checks the state of a SIP (Session Initiation Protocol) server, typically used for VOIP (Voice Over Internet Protocol) servers. It requires that you configure several parameters on the Special Parameters tab: SIP Method (OPTIONS, INVITE or REGISTER), SIP URI, SIP REG URI (only used for REGISTER), Max Forwards and the accepted response codes. For example, to configure an INVITE check, you would select INVITE as the SIP Method, specify “sip:100@111.222.111.222” for the SIP URL (using your IP address, of course), the SIP REG URI would be left blank, the Max Forwards would be set to “1” and the acceptable response codes would be set to accept “100”.
- SNMP: This monitor checks the state of a SNMP (Simple Network Management Protocol) server, typically over port 161. It requires that you specify the Community, OID and Threshold on the special parameters tab. This is a very powerful monitor that can query your SNMP server to detect a specific state in the response, for example, CPU load on a device. If the threshold response exceeds your configured value, it can be set to mark a device as DOWN. As an example, for the CPU example, you might configure your Community = “public”, OID = “1.3.6.1.2.1.25.3.3.1.2” (this is a common processor load OID) and Threshold (which would be returned from 0 to 100 because it is a percentage) to 50. When the CPU of the device exceeds 50 (%), it would mark the device as DOWN. (NOTE: For security reasons, of course, we recommend you create a unique Community for our use that is only authorized for specific GET requests).
- SMTP: This monitor checks the state of a SMTP (Simple Mail Transfer Protocol) server, typically over port 25. It does not have any configurable special parameters, but it performs a standard connection test much like you would see if you were to telnet to the server on port 25. A properly configured SMTP server would typically respond to the connection request with something like “220 mail.example.com ESMTP service ready”. The SMTP test looks for this response and if received, would consider the device UP.
- TCP-CONTENT: This monitor is similar to the HTTP-CONTENT monitor in that it can send a custom string and look for a specific response in the first 24K bytes of the Receive String. But unlike the HTTP-CONTENT monitor, it doesn’t expect common HTTP response codes as part of the response. This allows you to utilize it for non-HTTP content, and to use it to present an authentication header with a value using a base64-encoded string of the username:password in the request headers. For example, let’s assume you want to GET the contents of a page that is protected with Basic Authentication using a user name of “john” and a password of “doe”. First, you need to convert the username:password combination of “john:doe” (exactly, including the colon) at a website like www.base64encode.org. This produces the encoded string of am9objpkb2U= which you can insert into your send string. To do that, your send string should consist of the following: “GET / HTTP/1.1\r\nAuthorization: Basic am9objpkb2U=\r\n\r\n” This will allow the monitor to authenticate and then retrieve the string. (We recommend copying everything shown between the quotation marks to ensure you include the proper spaces as well.)
- UDP-CONTENT: Much like TCP-CONTENT, the UDP-CONTENT monitor type allows you to perform similar actions using UDP vs. TCP. There are a few subtle differences, however. Because UDP does not provide a mechanism for determining a connection state, you must either have the device send ICMP “Port Unreachable” when it is down, or specify the custom Receive String you would like to see… thus, the absence of it would take the device down. This monitor could be used to check the state of a DNS service, as an example.