Why are the DDoS Statistics Always Blank?
If you’ve gone to the NETWORKING > DoS/DDoS tab and haven’t seen any data, consider that a good thing! This means you haven’t received any attack traffic.
By default the DoS/DDoS tab will show stats for the last 7 days, but you can easily adjust the time range drop-down to one year to see if you’ve had any historic attacks. Hopefully those are blank too!
Do blank graphs mean protection is not working?
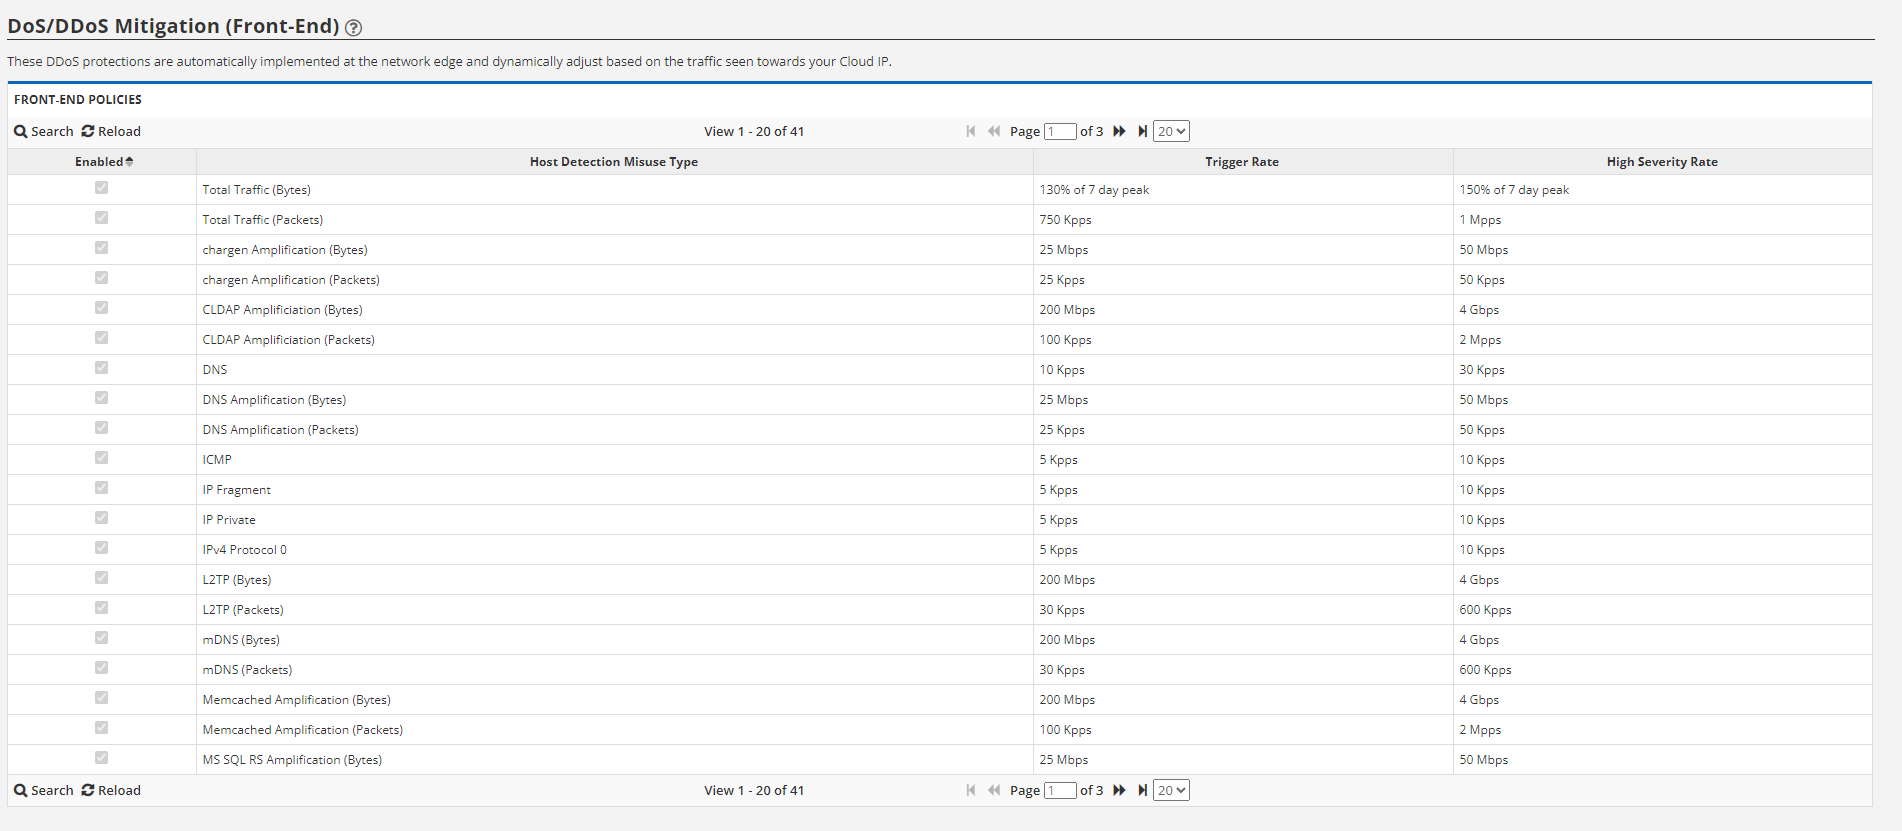
No, not at all. DDoS protection is working all the time. You can see the thresholds lower down on the page under the heading DoS/DDoS Mitigation (Front-End) as shown in the image below. We call these settings front-end because this protection protects attack traffic toward your public-facing cloud IP and this protection is done at the edge of our Network at every POP. Should they exceed these thresholds, we will begin protection and you will start to see data accumulate on the page within a few minutes.

If I do get attacked, what will the graphs look like?
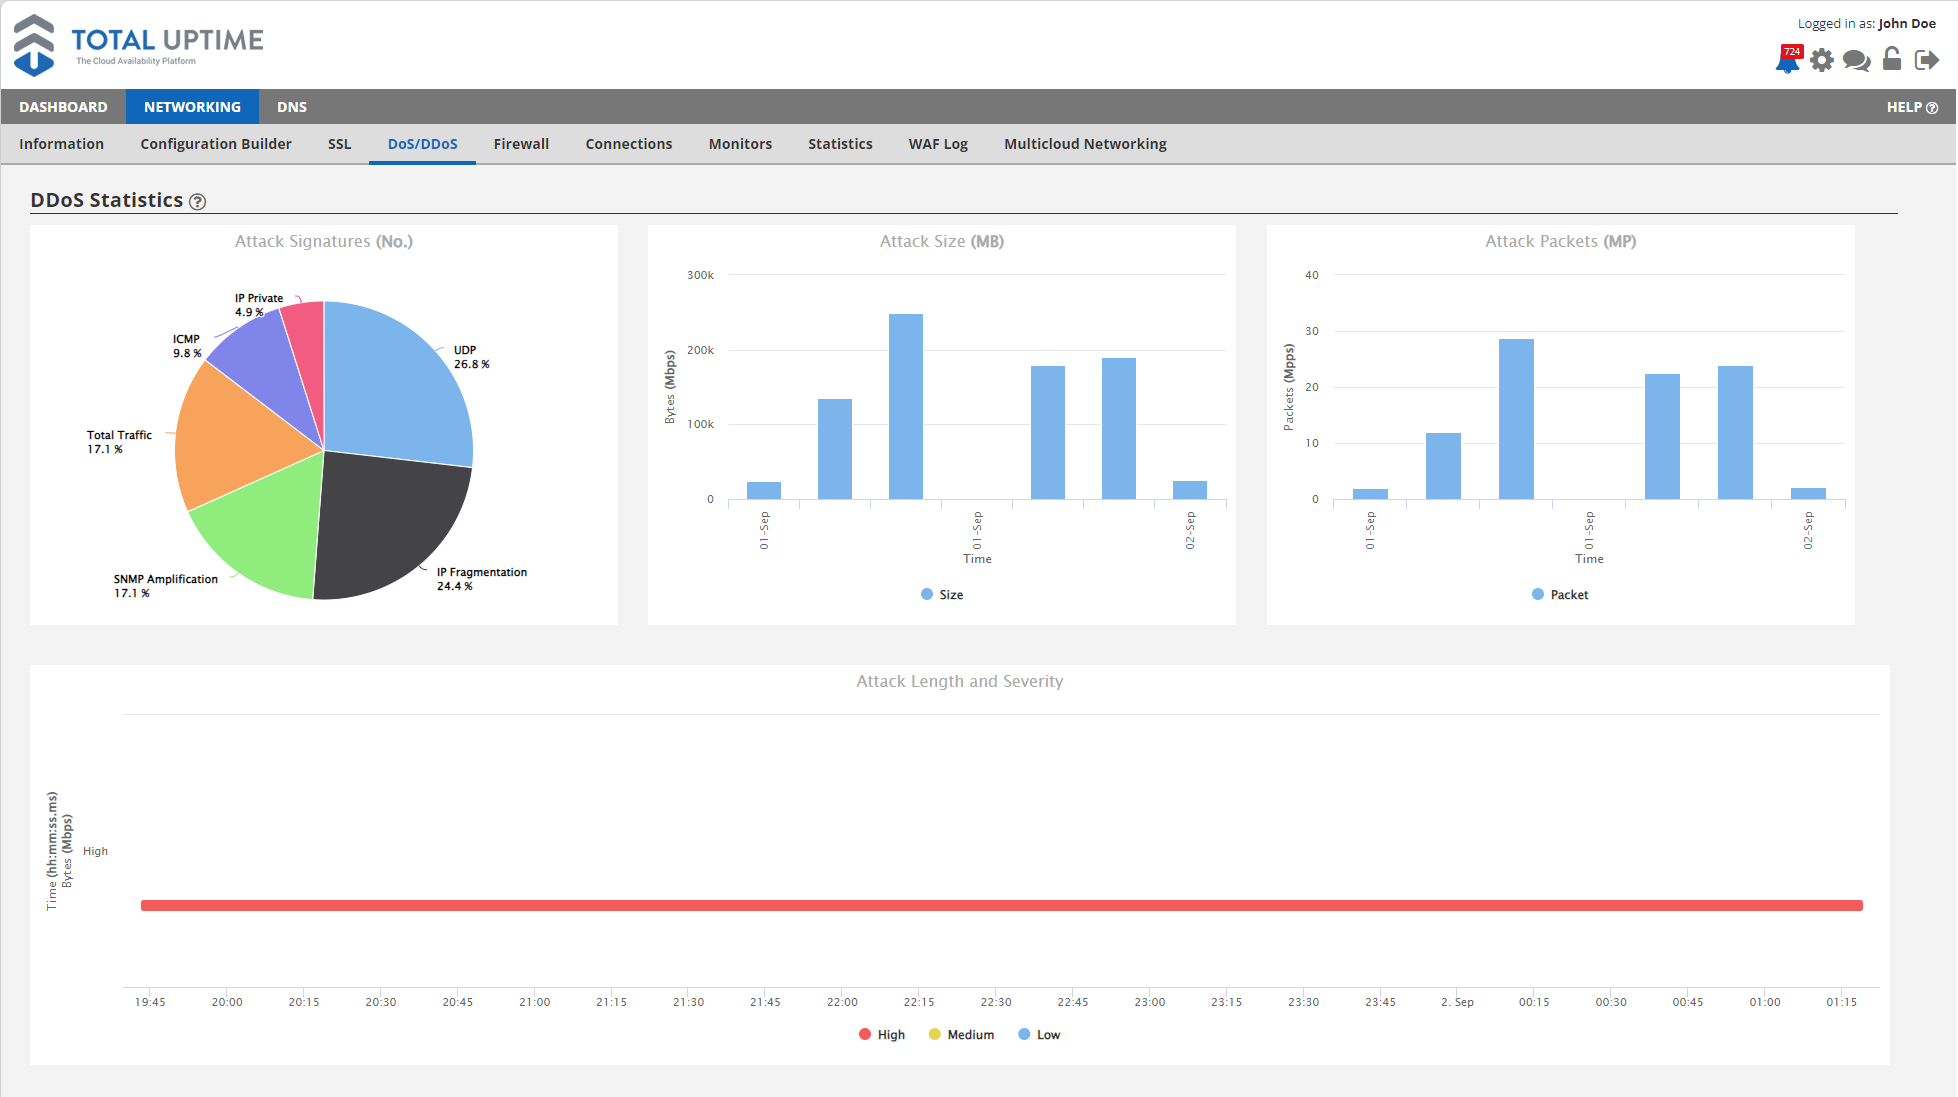
Below is a sample of graphs for an attack seen that peaked at around 250 Gbps. It shows the breakdown by attack signature, attack size and the number of packets. The attack length and severity bar shows the overall length of the attack for each of the 3 different severities. But of course, we hope you never see graphs like this 🙂

What happens when I get attacked?
Should an attack start against your IP that exceeds the thresholds, we will begin immediate mitigations. We may notify you via email of the attack and we will continue to protect your applications for as long and as large as the subscription plan allows. Should you wish to upgrade, you can do that at any time during the attack for continued protection should the attack persist longer than usual.
Of course, if you have any questions about our DoS/DDoS mitigation capabilities and techniques, do not hesitate to reach out to our team via chat or by opening a support case.