Top Tools for Network Troubleshooting
If you are a network administrator, you really want to get a handle on your network. But even laymen sometimes need to figure out what’s going on. There are some basic tools that will help you do that. Let’s have a look at some simple pieces of software that can be accessed from nearly any workstation.
Ping
In most instances, the first tool that network troubleshooters turn to is called ping. This command line resource goes back to the very founding of the internet. The creator of ping was a man named Mike Muuss. In December 1983, Muuss wrote the code for the ping command. It remains perhaps the most useful network troubleshooting tool to this day.
Mike Muuss was one of the architects and builders of the internet cathedral. “I happen to feel that TCP and IP are good protocols, and certainly much better than what we are using now,” he wrote in the ARPANET TCP/IP Digest. Muuss and his colleagues laid the foundation for the world of connectivity that we enjoy today.
Ping now stands for packet internet groper. But the name for ping comes from sonar technology. Ships use sonar to detect underwater objects. With active sonar, they send out sound waves and wait for echo responses. The same thing happens with ping. A network troubleshooter pings an IP address or domain name to find out if a remote device is alive. If the target machine is up and running (and ping replies are enabled – which is technically ICMP echo), it should return a reply that gives its IP address and indicates a response time in milliseconds.
Ping can be used to show whether a remote device is reachable and how long it takes to communicate with the originating machine – essentially, how far away it is. On most Linux servers, when you run a ping it will continue indefinitely until stopped. On Windows it defaults to sending 4 pings, so if you want it to run indefinitely, you must add the -t extension. Ping can be helpful when monitoring for intermittent network outages, jitter or distance. You can also send these results to a log file for analysis later.
A Ping Test from a Linux Machine
In this example we’ll simply type “ping 8.8.8.8” which is one of Google’s DNS IP addresses. Because it is Linux, it continues pinging until you stop/break it with CTRL + C
This is what the output looks like in our SSH window:
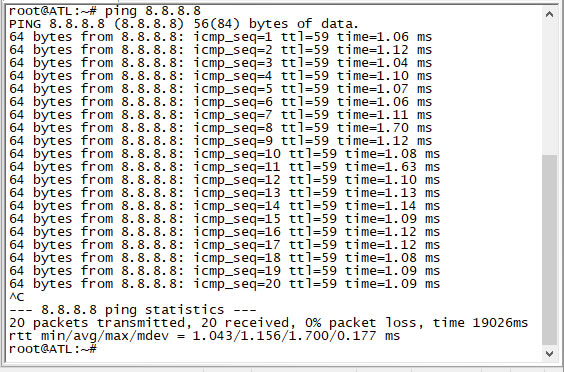
During the ping, you can see the response time at the end of each row. In this case, Google DNS is very close to our test server because it is just a little over 1ms. So if your objective was to determine how close this Google device was, the answer is pretty obvious, it seems to be next door.
You can see that after we stopped the ping, it provides a nice summary at the end that indicates how many packets were sent, how many were received, the computed packet loss as well as the average minimum and maximum response times in milliseconds (ms). This is all quite handy when you’re running a ping over a long time to determine if there is loss.
A Windows Ping Example
In Windows, it is somewhat similar. To ping on any Windows operating system, open up a command prompt. Then type “ping 8.8.8.8” just like you did for Linux.
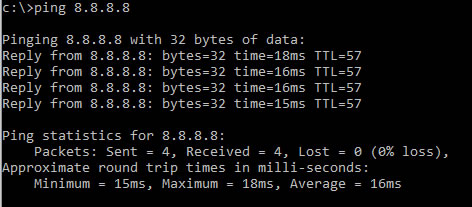
You’ll see that the output is very similar with the exception that after 4 pings it stopped and provided the results. In Windows it shows the response time 2nd from the last, so as you can see from this test machine, Google’s DNS server is a little farther away.
One final note about pinging. You don’t have to enter an IP address, you can enter hostnames too. So that means you could type “ping google.com” to have your local machine resolve DNS and ping at the same time.
A Caveat About Ping
Many network providers, including Total Uptime, will rate limit ICMP traffic to prevent aggressive users (or attackers) from consuming too many resources on various devices. Others will block ICMP completely. So if you see a ping timeout, it doesn’t always mean that the device you’re checking is down. In that case, you may want to try a TCP ping instead. This isn’t technically ping, but rather it is ping-like. It sends packets over a specified port to see if it replies which it will do if the port is open. One nifty tool you might like to try is tcping.exe. We won’t detail it here since the link provides many useful examples.
Traceroute
The traceroute command is used to show the path of a network connection. Like ping, traceroute operates at Layer 3, the network layer of the OSI model. That’s the layer where internet routing takes place. Using a variety of protocols and technologies, routers direct IP traffic on as straight a course as possible. One routing protocol is called Open Shortest Path First (OSPF). It uses Dijkstra’s algorithm, which happens to be the same algorithm used by GPS devices to show you the best driving route to your destination.
So internet protocol (IP) packets travel from an originating computer to a destination computer across at least one router. If the destination computer is far away, the packets could cross several routers. The aim of network designers is to keep the number of routers along the way (called hops) as low as possible, or at least to find the most efficient route.
Traceroute gives you a quick snapshot of the path that these packets are taking. A good routing tech can look at a traceroute of a network connection and get a very good idea of how well layer 3 networking is doing. A lot depends on how familiar he may be with the routing infrastructure. But even the layman can pick things up from looking closely. If there are more than a dozen hops, or if the path goes to a far-off router (sometimes even on another continent), you might want to question whether there are problems with the IP network.
A Traceroute Test from a Linux Machine
Here is a sample of how to perform a traceroute from a typical Linux machine. Like the example above, we’ll trace over to a Google DNS server to see what path it takes. The command is simple again, and here I simply need to type “traceroute 8.8.8.8” and hit enter.

In this example, I’ve clipped the right side of the output so it isn’t too small here in our blog. But you can see the output. The first hop has three asterisks (*) because it did not respond to any requests, but because traceroute knows that it exists, it still lists the hop. You can see that it takes 9 hops to reach the Google DNS server, and that it exists our test VM, goes through the local datacenter onto the Telia network before landing at Google.
A Traceroute Test from a Windows Machine
Windows supports traceroute too, but the syntax is just a little bit different. Open your command prompt window again and simply type “tracert 8.8.8.8”.

One difference about the Windows traceroute tool is that it doesn’t show precise milliseconds, it always rounds it to the nearest ms. We don’t like that as much, but in all honesty, it doesn’t make a huge difference.
So like ping, Traceroute takes it to the next level and shows more detail about the path the traffic takes, PLUS, traceroute pings each hop along the path to determine if it is responding or not and it resolves the IP address to a hostname if it is available to aid you in diagnosing how it is getting there.
MTR
If you like the traceroute tool, you’ll appreciate MTR even more. MTR reveals the path in a similar way to traceroute, but it takes it one step further by continuously analyzing each hop with repetitive tests until you stop the test. If you’re engaging an ISP or network provider to investigate packet loss or latency, they will often prefer an MTR over a traceroute because of this extra component. Where a traceroute shows a point in time, an MTR shows packet loss over an extended period of time, which can better pinpoint network issues.
An MTR from a Linux Machine
From my Linux test machine, running an MTR is easy. Simply type “mtr 8.8.8.8” and hit enter. The below result will display and will continue to run indefinitely.

In this example above I’ve stopped the test with CTRL + C after 134 tests were sent to each hop, as you can see by the Snt column. Because the last hop shows 0.0% packet loss and the pings have very little jitter (difference between the best and the worst), this is a very clean route that should not exhibit any issues.
An MTR from a Windows Machine
Many folks don’t think Windows has MTR functionality, but it does! It’s just called pathping and it produces very similar results. However, instead of running indefinitely until cancelled, it will run for a predetermined amount of time based on the number of hops. To run it in windows, open a command prompt again and simply type “pathping 8.8.8.8”.
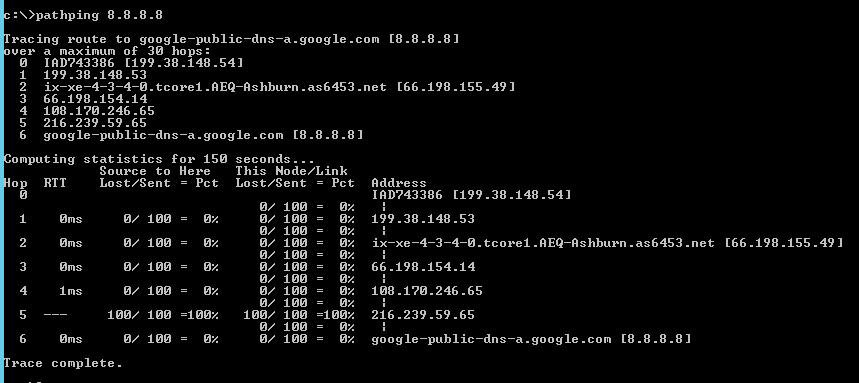
You’ll see that the top gives you a trace, just like it odes for tracert, and below it probed each of the hops for a while to determine if there was any packet loss. Hop 5 looks like it has 100% packet loss, but this is quite normal. So long as the last hop is all clear, this is another example of a very good result.
Another tool for Network Troubleshooting
If you’re not keen on either of these options because they aren’t pretty enough, you might like a little piece of software for Windows called PingPlotter. It does the same thing as a Linux MTR by continually probing each hop in a traceroute, but it goes one step further and plots them all on a cool graph. With their PingPlotter pro tool (which we use here at Total Uptime) you can even right click on the graph and choose a longer period of time to show the results for, PLUS, to make things even more fun, you can have a whole bunch of traces running at the same time.
Ipconfig / ifconfig
You can also learn a lot about your own workstation at the command line. On a Windows machine, the command ipconfig will tell you what your own IP address is, your gateway router, and what network mask is in use. With an ipconfig /all command, you can see the physical address (MAC address) and a bit more information about your network interfaces. Each interface will have its own MAC address.
On a Linux machine, the command is ifconfig. In this context you can even find information about network traffic on the interface. You can also use the command to enable, disable, or configure interfaces.
The advantage of ipconfig/ifconfig is that it gives you a quick snapshot of the status of your network interfaces. It’s very helpful when troubleshooting connectivity while logged into the workstation itself.
But if it is the external IP address you’re looking for, this won’t help because you’re most likely behind a firewall. Your external or public IP address is often required when submitting ping or traceroute results to your ISP so they can perform the same tests back to your location. The easiest way to find out what your IP is by using our tool at http://tools.totaluptime.com/myip. When you visit that link, you’ll see the IP address the outside world sees you coming from.
Conclusion
This a very short list of network troubleshooting tools. Other writers might have selected different ones, or made the list a bit longer. One website puts the number at seven. Microsoft’s “Overview of TCP/IP Troubleshooting Tools” includes eleven. It would be easy to throw in tools like netstat or nslookup. Then there are websites (see below) and software that include many of these tools as part of their troubleshooting solutions. The best thing to do is to find the ones that you are most comfortable with or that you believe help you the most. Sometimes staying with the basics is the best strategy of all.
Here are some websites that can help you with troubleshooting using servers from across the world:
Wheres It Up
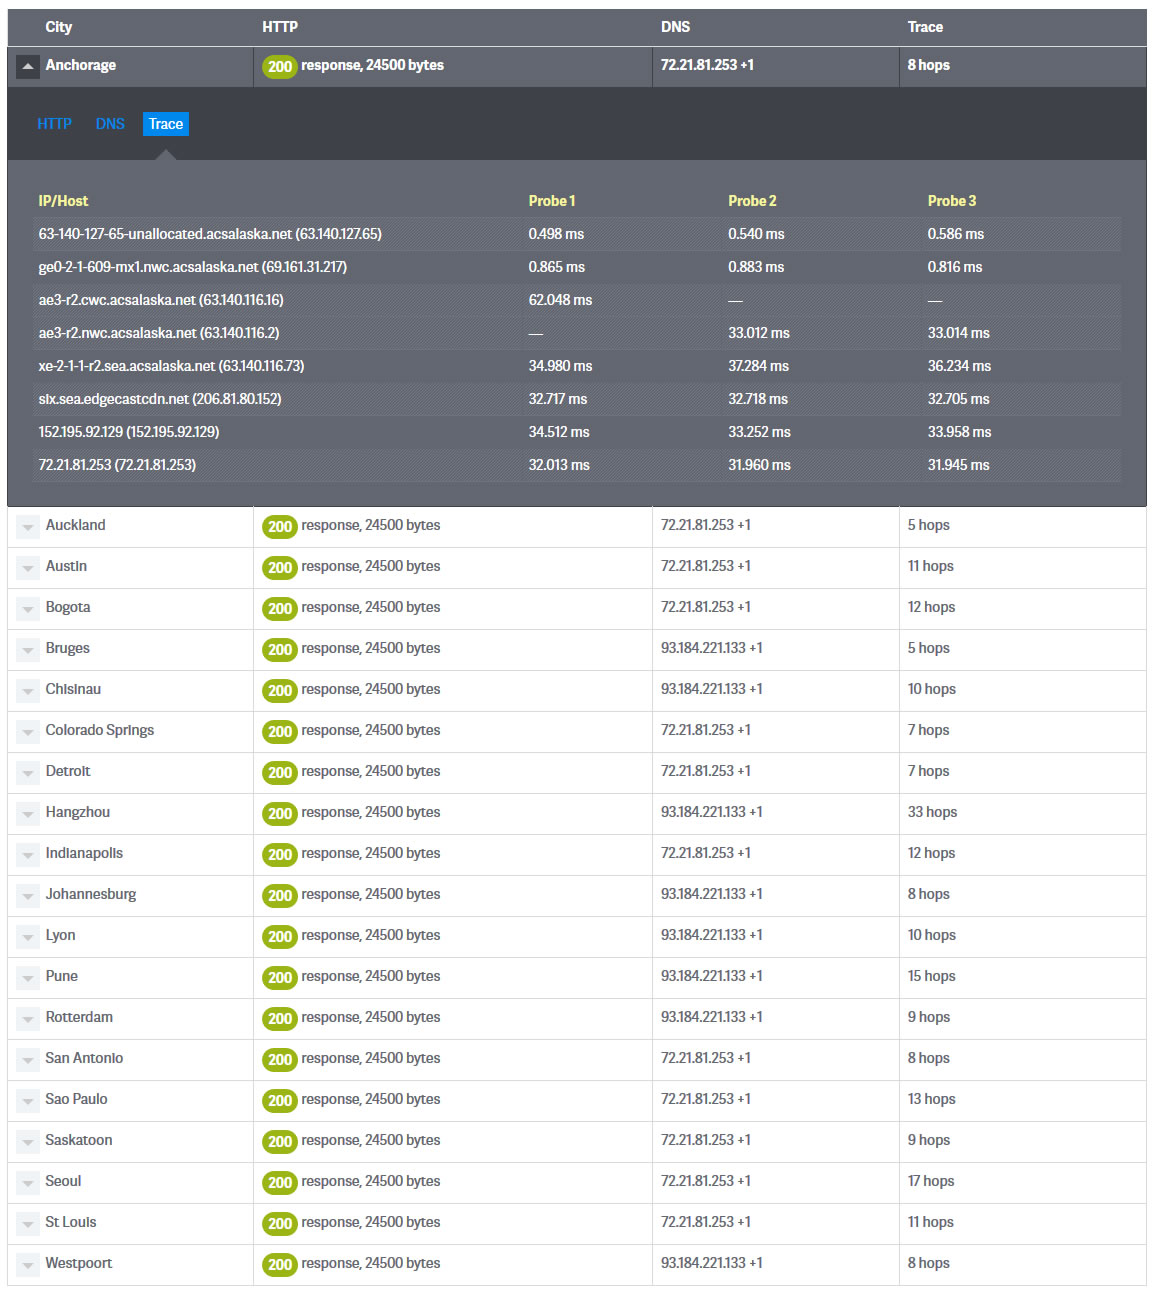
This tool is very handy for checking if your website is responding with the proper HTTP response codes from various points around the world. Use the default selection, or choose your own cities. The output will even show the IP address resolved by DNS and a traceroute.
Here is the result of a test we ran against totaluptime using their default list of cities.
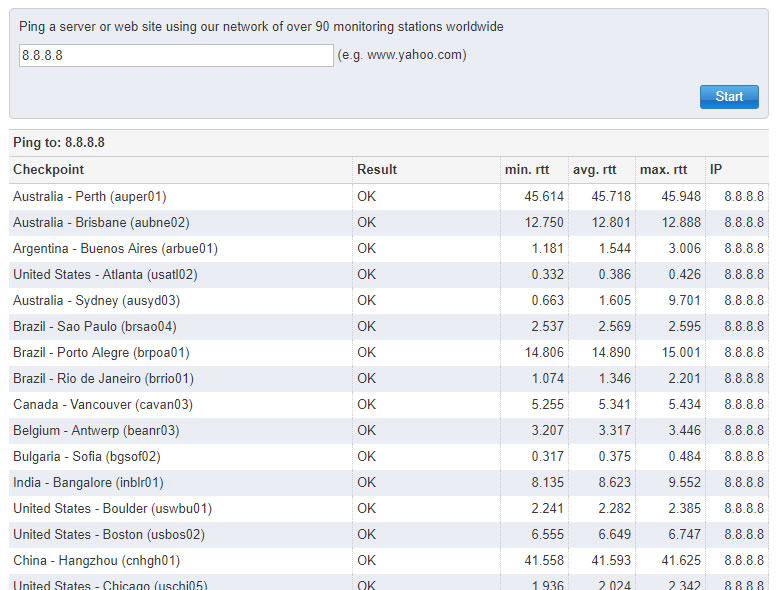
CA App Synthetic Monitor Ping Tool
This is another really handy tool for pinging a hostname or IP address from over 100 locations around the world simultaneously. In the screen capture below, I’ve only shown a small portion of the long list of sites that pinged the Google DNS server for availability. Try your own site!
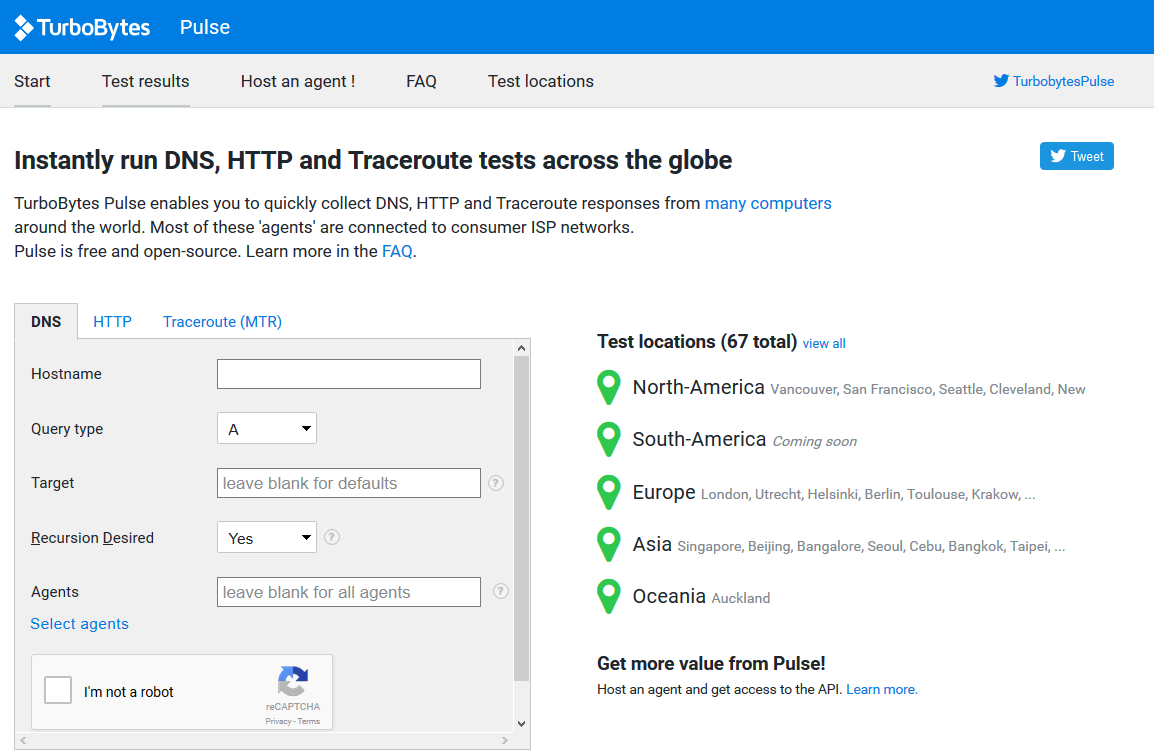
TurboBytes Pulse
We like the Turbobytes tool quite a lot too because it can do three types of checks. DNS lookups, HTTP tests (just like wheresitup) and Traceroute (MTR)s. Each can be performed from multiple locations around the world.
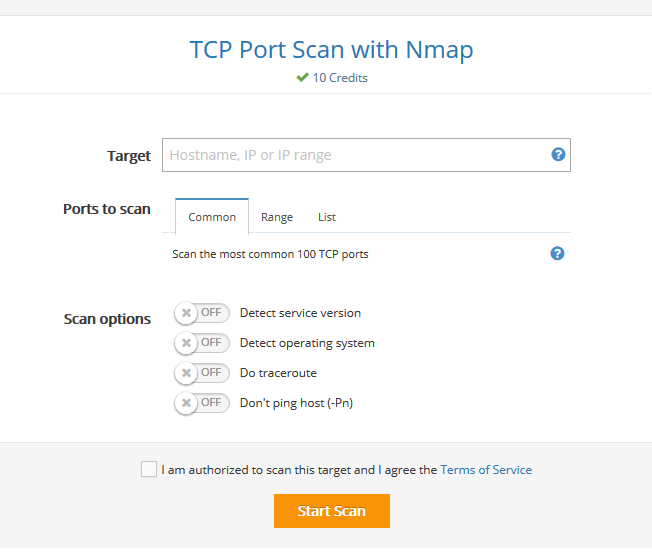
TCP Port Scan with Nmap
And here is one that gets even more granular. The pentest tools site does a number of tests, but the ones we like the most are the TCP port scans. Here you can enter a hostname or IP along with a range of ports to scan. The tool will check and tell you when they are open or not. This can be particularly handy if you’re sure you’ve opened a port to a device on your firewall but need some validation.
 What is an Application Delivery Network?
  Global Server Load Balancing (GSLB)
  Measuring Failure


