What is an Application Delivery Network?
  Global Server Load Balancing (GSLB)
  Measuring Failure
 Top External Monitoring Tools in 2020
What is external monitoring? In a general sense, it means regularly checking on something to find out what is happening. It’s a way to gather information. In a large network, it means observing and recording data from a wide variety of devices and applications. We should clarify that monitoring and management are not the same things. The data points collected through monitoring are used to take action to correct and improve network issues through proper management. But in order to gather these data points, you must have monitoring. A blog writer for BMC put it this way:
“In its simplest description, infrastructure monitoring can be thought of as the continual collection and review of meaningful data about the infrastructure. This continual collection and review of data is what enables effective infrastructure management.”
- Naigos
- Zabbix
- PRTG
- SolarWinds
- ManageEngine
- Pingdom
- Uptrends
- Statuscake
- Site24x7
- Newrelic
- Dynatrace
- CA App Synthetic Monitor
On-Premise External Monitoring Tools
Nagios
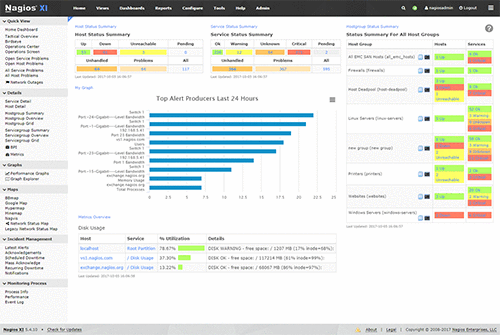
If you look at the website for Nagios, you’ll see that they are all about monitoring. Their landing page includes links to system monitoring, protocol monitoring, application monitoring, as well as database, log, and bandwidth monitoring. “Nagios XI provides monitoring of all mission-critical infrastructure components,” they tell us.
Nagios XI includes enterprise server and network monitoring software. For an implementation designed to monitor 1000 or more hosts, Nagios recommends installing a physical server rather than a virtual machine. The software can be downloaded for Microsoft, VMWare, or Linux platforms. You can run a fully-functional free trial of the Nagios software for 60 days before you decide to purchase.
Zabbix
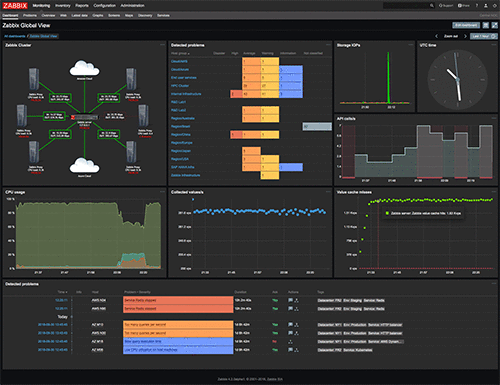
Another monitoring solution that you might consider is Zabbix. They tell us that their solution will monitor “any kind of IT infrastructure, services, applications, resources”. The software is open-source and free, and is used by such global brands as Dell, Salesforce, and T-Systems. Zabbix boasts that their solution is enterprise-ready, with unlimited scalability, distributed monitoring, high availability, and strong security.
A brief overview video on YouTube touts the company’s broad outreach as well as its many features. The list of industries includes:
- Aerospace
- Retail
- Energy and Chemicals
- Banking and Finance
- Education
- Government
- Healthcare and Medicine
- Marketing
- IT and Telecommunications
The company offers a wide array of solutions and services, as well as training and certification programs. Product features include metric collection, auto-discovery, visualization, and effortless deployment.
PRTG
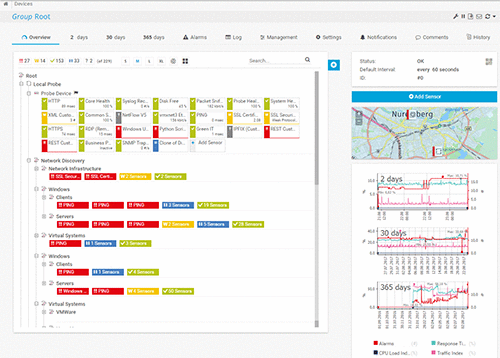
The external monitoring software from paessler.com is highly rated. PC Magazine give them an excellent in their online review of PRTG Network Monitor. “The tool excels at its primary focus of being a unified infrastructure management and network monitoring service,” they write. The PRTG platform is free for up to 100 sensors.
Paessler’s PRTG product description tells us that it can monitor your entire IT infrastructure and is ready for every platform. They get by with saying that because they include both a Windows version and a cloud solution. So what is the “everything” that PRTG says that they can monitor? Here’s a shortened list:
- IoT
- Cloud services
- Packet loss
- Network traffic
- Ping status
- Active Directory
PCMag really likes the hierarchical device view. They believe that PRTG would be a solid choice for companies of all sizes.
SolarWinds
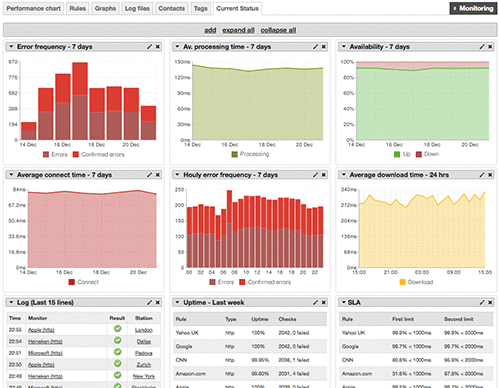
A guided tour of the SolarWinds Network Performance Monitor (NPM) gives us a good 10-minute introduction to the product. The four main areas that the NPM covers are: 1) fault tolerance; 2) performance metrics; 3) hardware health statistics; and 4) deep packet analysis and inspection. It can use the protocols ICMP, SNMP, or WMI. SolarWinds has built-in network discovery, which is an excellent tool for an extensive data center audit.
SolarWinds is an established company that has been around since 1999. NPM is only one of many products that they offer. Their multi-vendor approach allows for in-depth analysis of everything from Cisco to F5. SolarWinds brags on the “unexpected simplicity” of their NPM user interface, and their dashboards are fully customizable.
ManageEngine
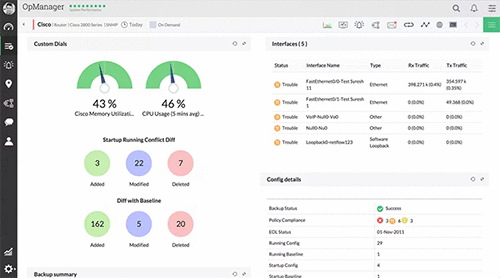
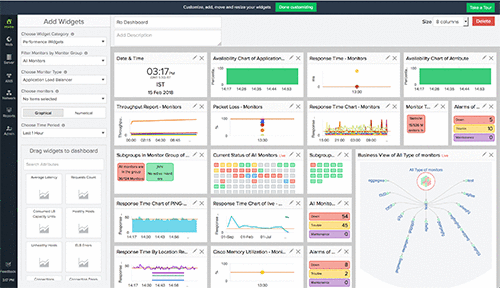
According to ManageEngine, their software is a comprehensive IT management solution, “bringing IT together”. Their network monitoring application is called OpManager, and the focus is on switches, routers, firewalls and virtual machines. As we said, the reason for all this network monitoring is to find a way to properly manage the network. ManageEngine offers an example of how OpManager can contribute to network management by helping to find the root cause of lost packets.
You can monitor up to 10 devices for free with OpManager. They also offer Essential and Enterprise editions. ManageEngine also offers a phone app to go along with the OpManager. Their built-in network monitor tools include ICMP ping, traceroute, SNMP MibBrowser, and a sysLog viewer.
Online External Monitoring Tools
Along with the downloadable software solutions that you can install on your local servers, there are plenty of online network monitoring solutions for you to choose from. You might also want to review some of the Top Tools for Network Troubleshooting that we covered in a prior blog post. There are plenty of online external monitoring tools out there, and the few that we have selected are only a small representation.
Before we move forward, it might help to explain a bit about some of the protocols used in network monitoring. ICMP is short for Internet Control Message Protocol. It is commonly referred to as ping. If you ping a remote network device, you are using the protocol ICMP. You can tell if a computer is online if it responds to your ping and sends back ICMP packets. Another important protocol is SNMP, or Simple Network Management Protocol. This protocol can use agents and traps to capture key information about remote devices. Windows Management Instrumentation (WMI) is used to manage Microsoft infrastructure.
Pingdom
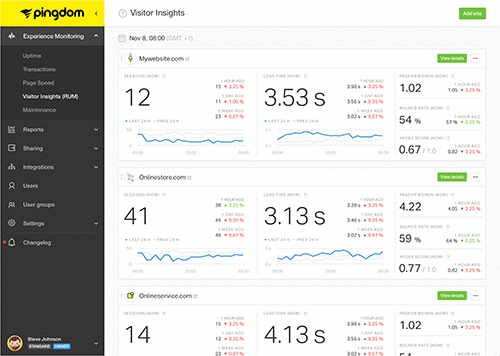
It’s not difficult to figure out which protocol the Pingdom suite of monitoring tools is built upon. Their uptime monitoring tool will let you check a network device’s availability from different locations around the world. But they use more than the simple ICMP protocol in their Pingdom, including transaction monitoring, server monitoring, alerts, and insights.
Uptrends
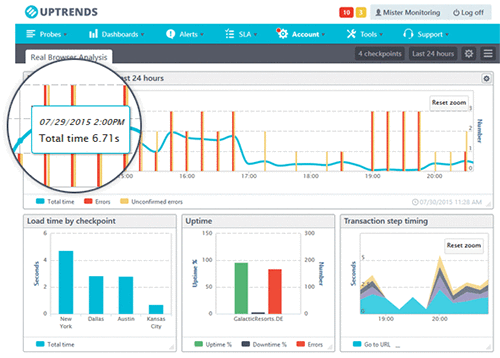
The solutions provider Uptrends offers both basic and advanced versions of their website monitoring toolkit. The Professional edition, for instance, includes 250 basic monitors, and the advanced options include multi-browser monitoring, and permit unlimited operators. Uptrends calls its product the “all-in-one monitoring tool”. They offer solutions for website uptime monitoring, web performance monitoring, and web application monitoring.
Statuscake
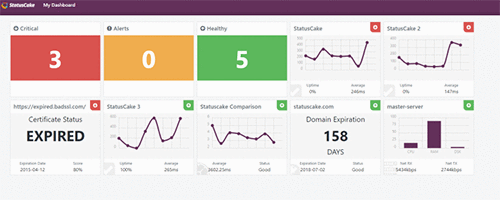
Uptime monitoring and website performance appear to be the main focus of Statuscake. It’s interesting that the note that they deal with more protocols than the three that we mentioned earlier. Statuscake supports HTTP/HTTPS, TCP, SSH, DNS, SMTP, PING & PUSH, according to their website. They offer website monitoring of these protocols from 28 countries worldwide. Statuscake also offers monitoring of domains, SSL certificates, servers, page speed, and viruses.
Site24x7
This provider of external monitoring tools caters to DevOps and IT support teams with the following offerings:
- Infrastructure and cloud monitoring
- Application monitoring
- End user monitoring
The approach of Site24x7 is to monitor how your applications behave. The company provides tools for web masters to keep an eye on their sites and see how they are performing from the perspective of Site24x7’s many global monitoring locations. The user can monitor web transactions as well as a variety of web services, such as email and domains. They also offer backend monitoring of mobile apps.
Newrelic
“Track every change across all your apps and services with pinpoint clarity and full context.” That’s the claim of Newrelic, a team of self-professed “data nerds”. They tell us that they live by the mantra “Life’s too short for bad software.” The company has been in operation since 2008. Newrelic offers solutions for DevOps, cloud adoption, and digital customer experience. Their infrastructure monitor promises full-stack observability, faster MTTR, and unified DevOps tooling.
Dynatrace

The Dynatrace platform is engineered for cloud native and hybrid environments. They support dozens of technologies from A to Z. They even include something called AIOps in their portfolio. “Our AI goes beyond correlation and uses true causation to determine the precise root cause of a problem.” Dynatrace says that their cloud infrastructure monitoring is “AI-powered” and fully automated.
CA App Synthetic Monitor
This website performance external monitoring tool from CA Technologies conducts checks as if it were an external user. This company offers five different plans and a 30-day free trial. They operate monitors from 88 stations in 46 countries. Their product includes full-page and real browser monitoring. You can configure the triggers that create alerts and notifications, and there is a fully-customizable dashboard.
Conclusion
We grant honorable mention status to a platform called Spiceworks. This is a free platform created for IT support techs to track and monitor their troubleshooting efforts. One drawback is that it only works for Windows machines, and the software is only free because it is supported by ads. The list could go on for pages, but we have to stop somewhere.